

MessiahDecoy123
Psychological Anarchist
- Joined
- Jan 25, 2008
- Messages
- 24,861
- Reaction score
- 3,549
- Points
- 103
Discuss the general election here.
 www.semafor.com

 thehill.com
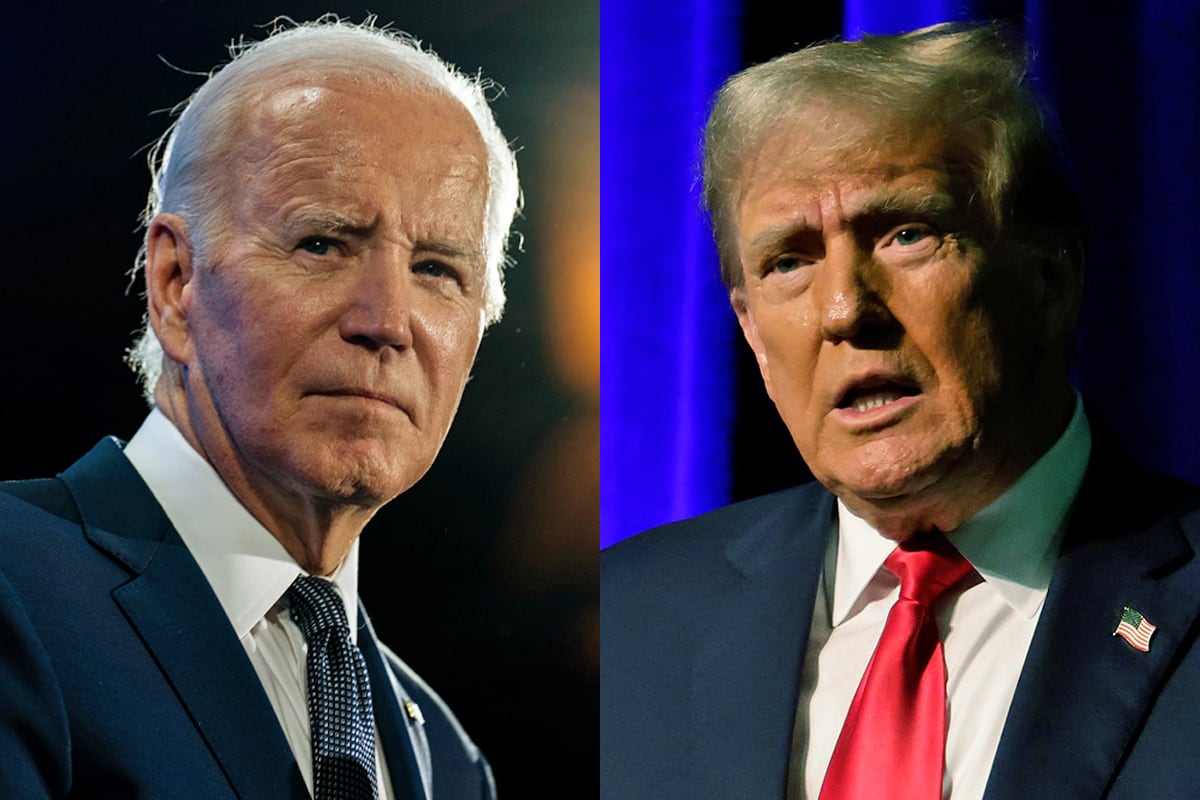
Hopefully we'll see more ads like this from Biden in the coming months.Joe Biden Turns Trump's Biggest Conspiracy Theory Against Him In Scathing New Video
The president put Trump on blast for trying to steal an election and then rewrite history about it.www.huffpost.com
| ✅ presidents who won reelection (71%) Democrats: 88% (7/8 elections) Republicans: 56% (5/9 elections) | ❌ presidents who lost reelection (29%) Democrats: 12% (1/8 elections) Republicans: 44% (4/9 elections) |
| 1924 Coolidge (R)* 1936 | 1940 | 1944 F. Roosevelt (D) 1948 Truman (D)* 1956 Eisenhower (R) 1964 Johnson (D)* 1972 Nixon (R) 1984 Reagan (R) 1996 W. J. Clinton (D) 2004 G. W. Bush (R) 2012 Obama (D) | 1932 Hoover (R) 1976 Ford (R)* 1980 Carter (D) 1992 G. H. W. Bush (R) 2020 Trump (R) |

Popular Vote % (2004-2022) | |||||
|---|---|---|---|---|---|
Year & President | House Ds | D Presidential Ticket | House Rs | R Presidential Ticket | |
2004 Bush | 46.6% | 48.3% | 49.2% | 50.7% | |
2006 Bush | 52.0% | | 44.1% | | |
2008 Bush | 52.9% | 52.9% | | 42.4% | 45.6% |
2010 Obama | 44.8% | | | 51.4% | |
2012¹ Obama | 48.4% | 51.0% | | 47.1% | 47.1% |
2014 Obama | 44.9% | | | 50.7% | |
2016² Obama | 47.3% | 48.0% | | 48.3% | 45.9% |
2018 Trump | 52.9% | | 44.3% | | |
2020 Trump | 50.3% | 51.3% | | 47.2% | 46.8% |
2022 Biden | 47.3% | | | 50.0% | |
| average (midterm) | 48.4% | 48.1% | |||
average (all) | 48.7% | | | 47.5% | |
average (pres.) | 49.1% | 50.3% | | 46.9% | 47.2% |
 tradingeconomics.com

 thehill.com

 www.nbcnews.com
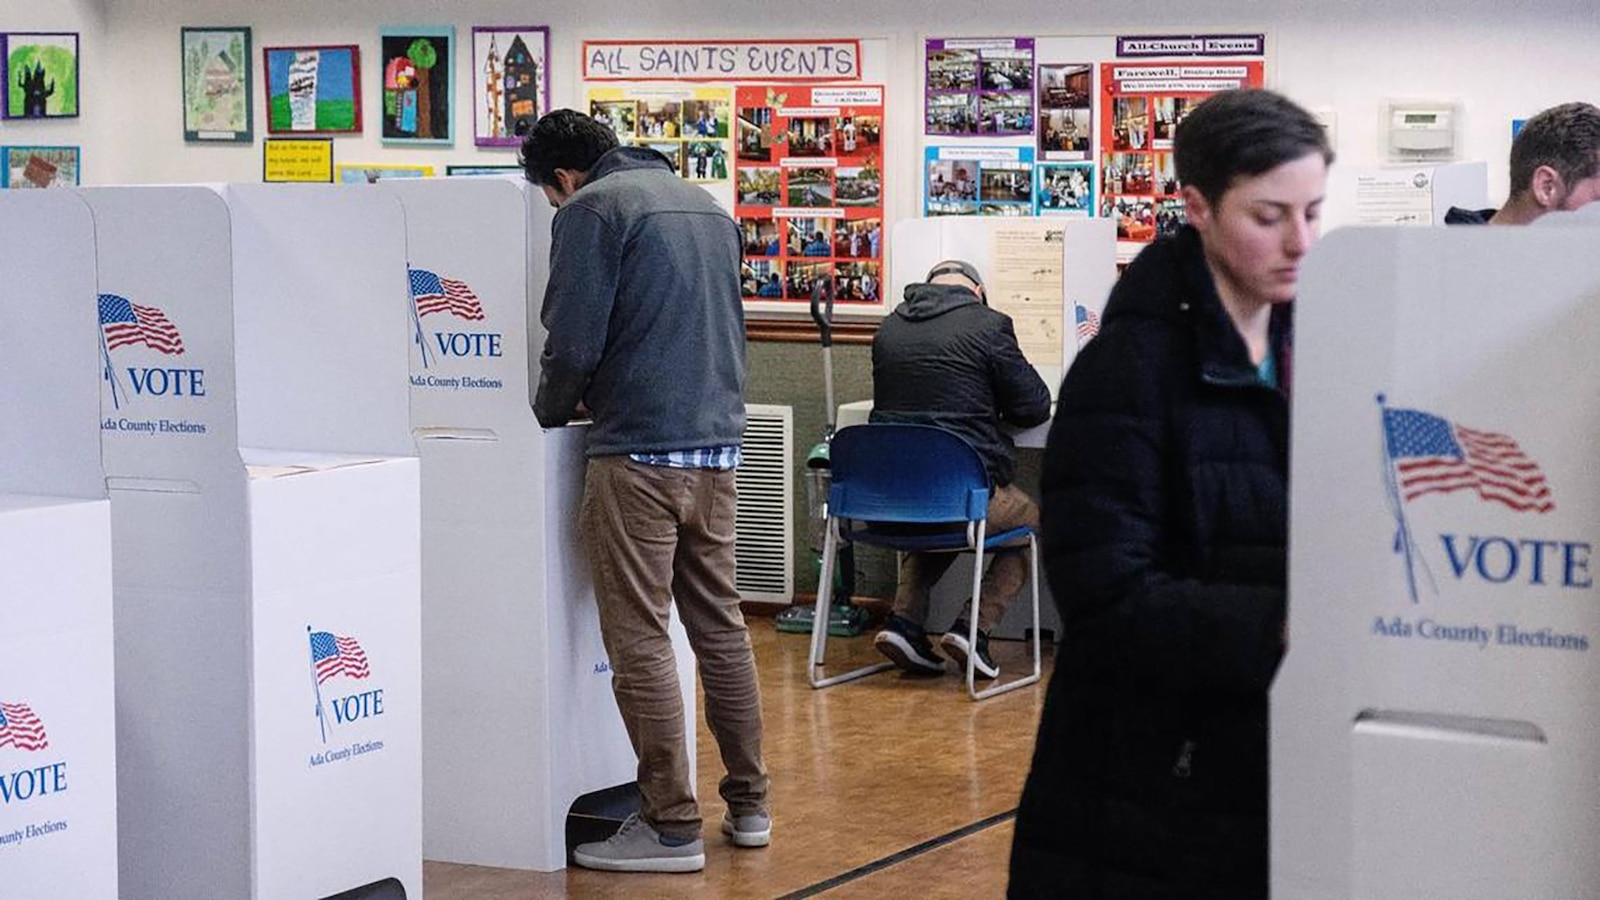
Yeah.....I've said this before. AZ is HUGE in the upcoming election. A senate seat is at stake AND IF Biden can take the state, he could conceivably lose GA and MI or PA.The biggest fights of the 2024 election are all converging in Arizona
The battles over control of Washington, abortion policy and more are all on the ballot in one of the country’s most tightly divided swing states.
I really hope this happens, if only as a sign that people have had enough of the GOP bs.Yeah.....I've said this before. AZ is HUGE in the upcoming election. A senate seat is at stake AND IF Biden can take the state, he could conceivably lose GA and MI or PA.

 www.newsweek.com
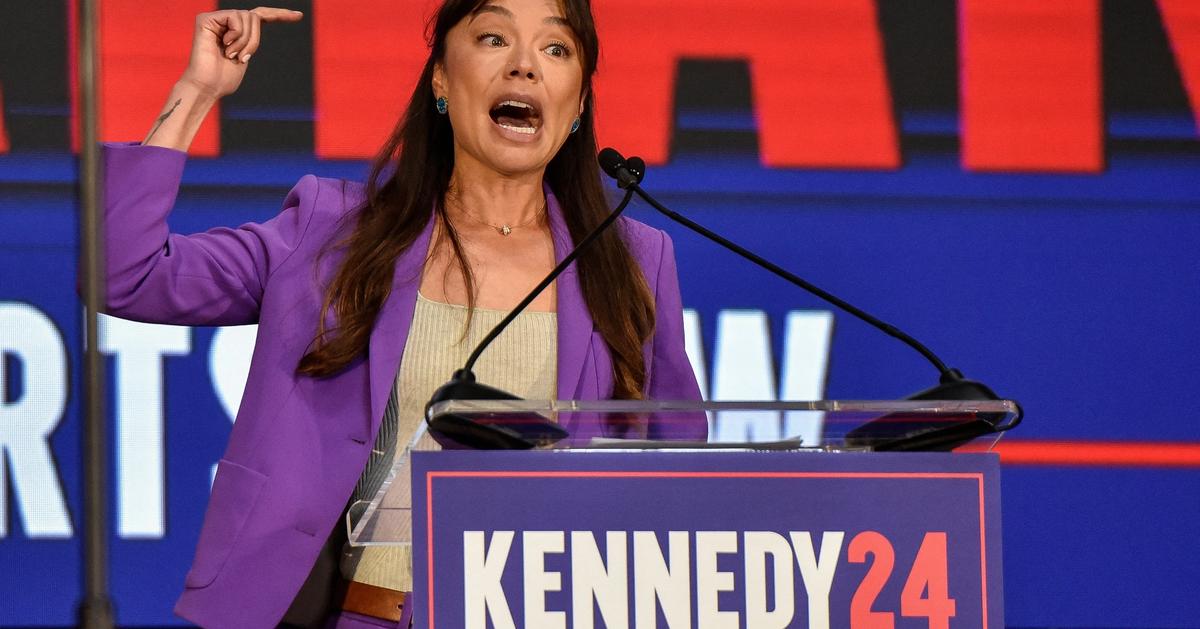
One of the few people who is on Truth Social should start plastering Kennedy's position all over it. In fact, in fact, all of the major social media platforms should get inundated with it.Trump's motivation for attack on RFK Jr. questioned
Trump insisted that RFK Jr. was only a "political opponent" to President Joe Biden and "great for MAGA."
How many active users does Truth Social actually have? Lol.One of the few people who is on Truth Social should start plastering Kennedy's position all over it. In fact, in fact, all of the major social media platforms should get inundated with it.

A little over 500,000. X has about 75M and FB has around 150M....I think.How many active users does Truth Social actually have? Lol.

 www.usatoday.com

 www.independent.co.uk
It better cost him the election.How Trump’s ‘woman problem’ has become an election nightmare
The former president – and his appointments to the Supreme Court – ended American women’s constitutional right to get an abortion. Trump used to crow about it, but he now knows it could cost his party dear at the election, writes Jon Sopel

 www.newsweek.com
Whatever it takes for Trump to lose.It better cost him the election.
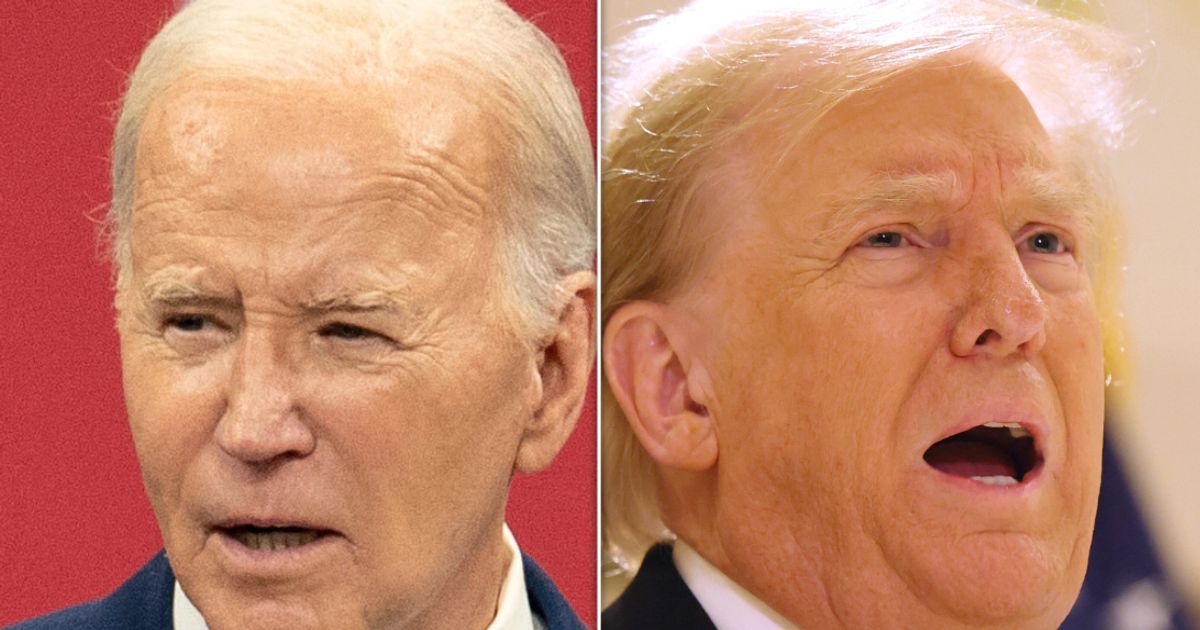
Hope these polls are actually right.Joe Biden gets good news from America's most accurate pollster
The president continued to close the polling gap against Trump with months still to go before the general election.
 www.usatoday.com